The deliverable, before you send a single row of data

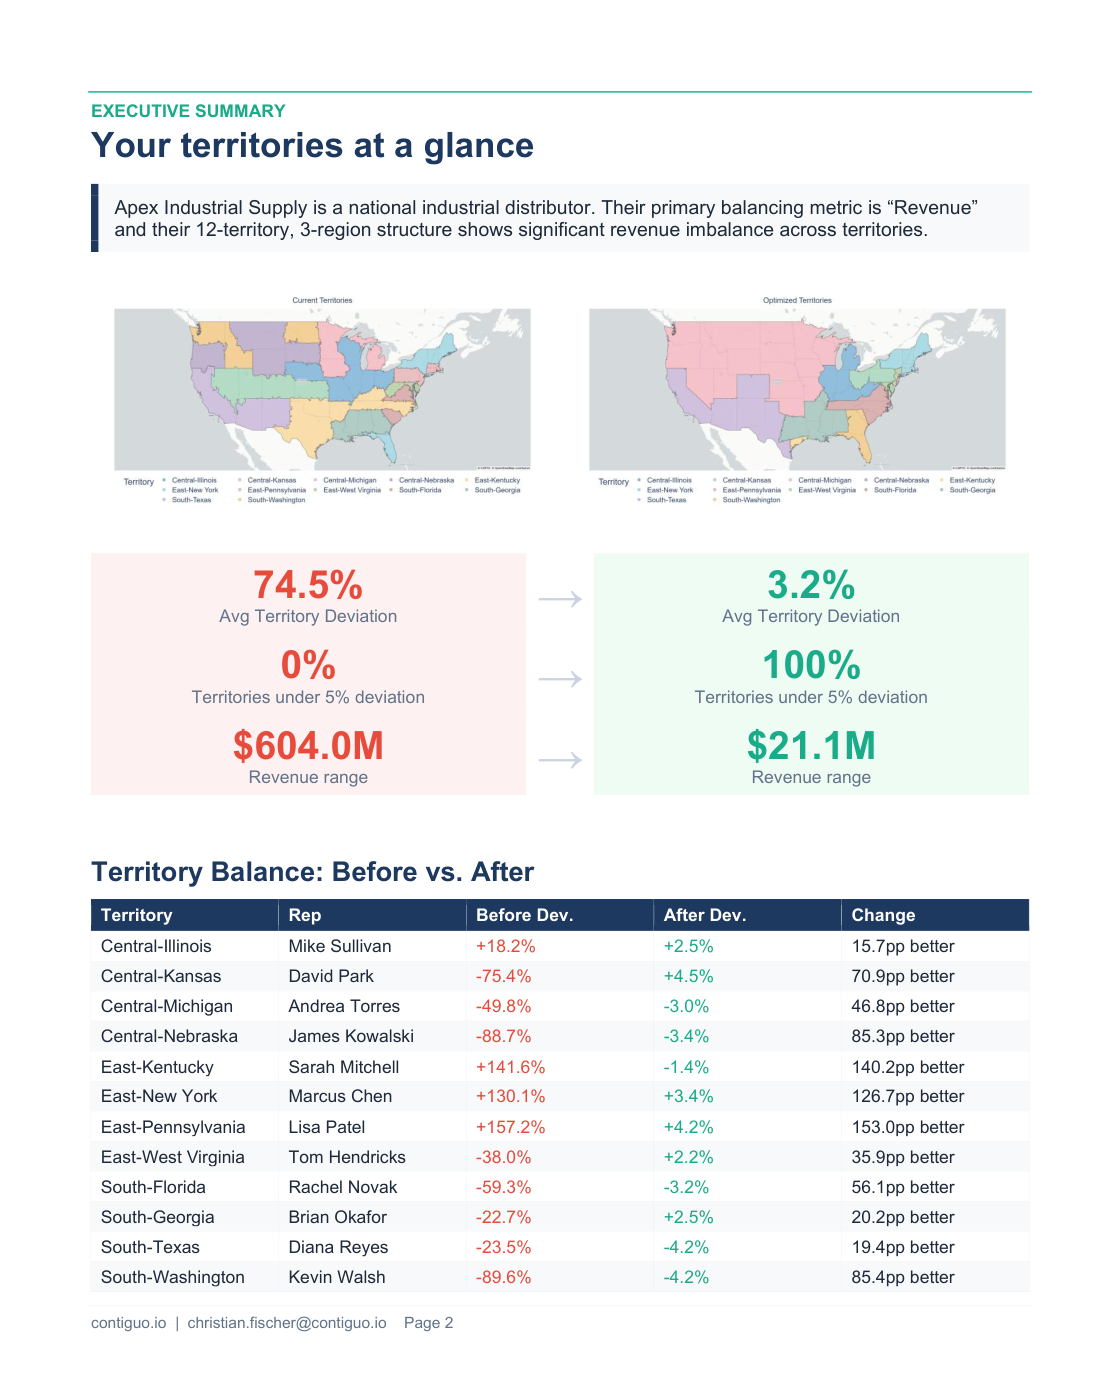
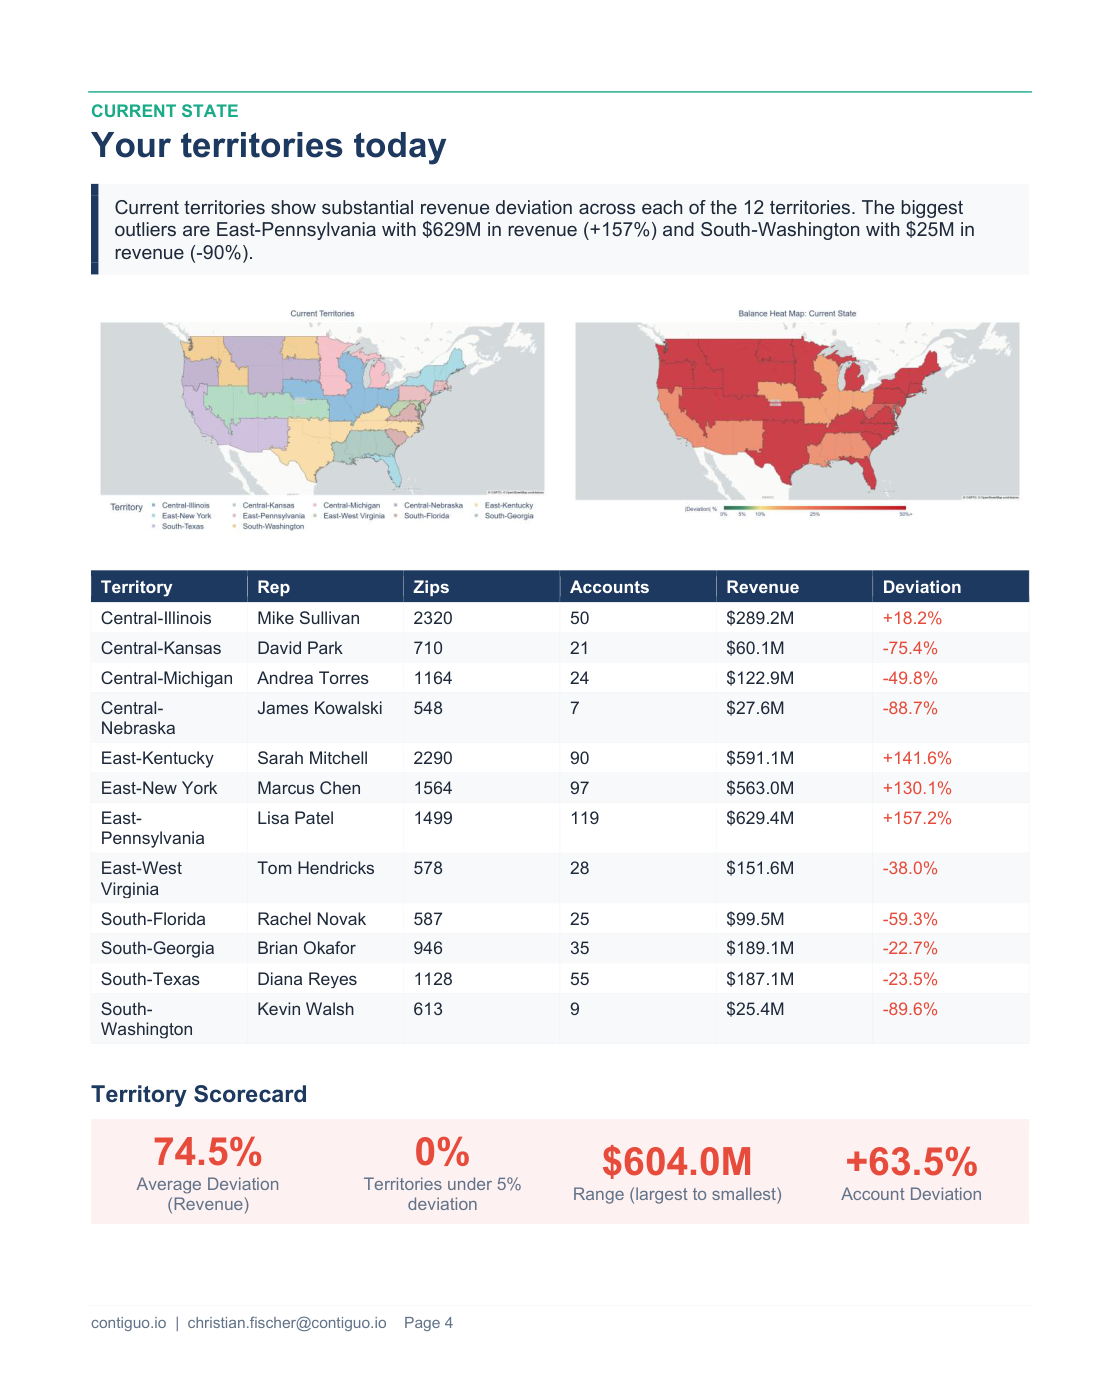
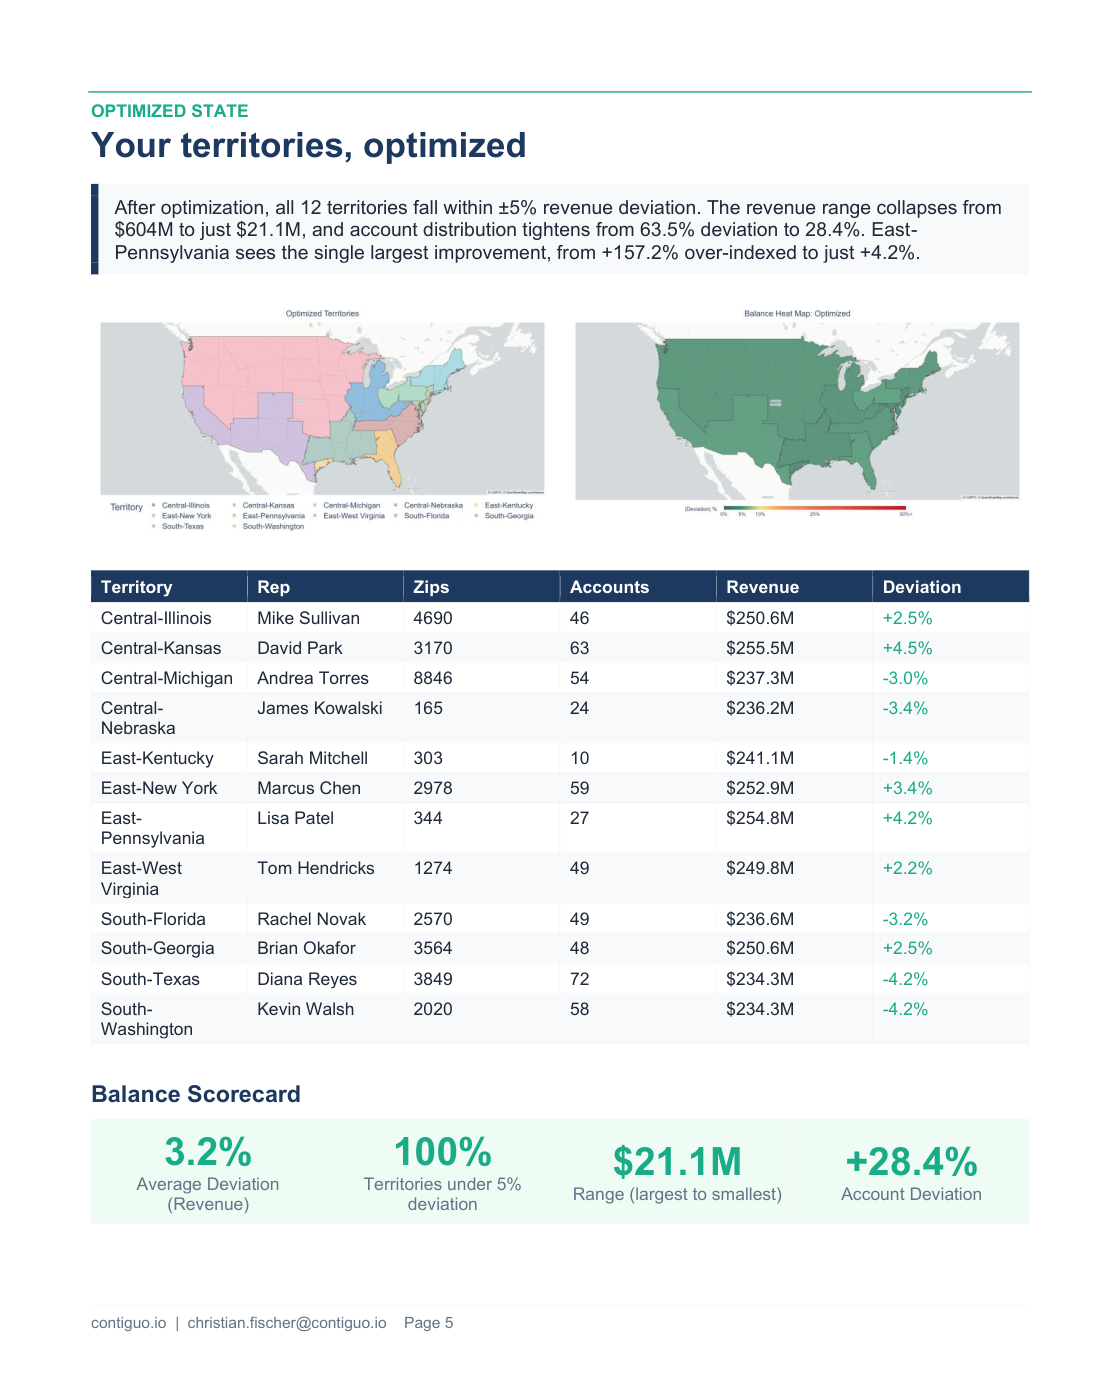
This is a complete, real output of our assessment engine, run on a sample dataset (Apex Industrial Supply, a fictional national distributor with 12 territories and $2.9B in mapped revenue). Names are invented. The analysis, maps, and math are exactly what you receive.

Download the full sample PDF →

What 48 hours returns

Executive summary page: side-by-side current vs optimized territory maps, average deviation falling from 74.5% to 3.2%, revenue range tightening from $604M to $21M
Executive summary: the whole story on one page. This sample organization went from 74.5% average revenue deviation to 3.2%, with every territory inside the 5% band.
Current state page: territory map, heat map, and a rep-level table showing each territory's zips, accounts, revenue, and deviation
Current state: every territory and rep quantified. Zips, accounts, revenue, and deviation from ideal, so you can see exactly who is starving and who is coasting.
Optimized state page: rebalanced territory map, green heat map, rep-level table within 5% deviation, and a balance scorecard
Optimized state: the same team, rebalanced on contiguous zip geography. Implementation files (zip to territory to rep) are generated from this model and load straight into your CRM.

Get this for your team

The assessment is free and takes 48 hours from data in to report out. You send two CSV exports (an account list and a rep roster, about 10 minutes of work). No call required, no strings.

Email for the data spec →  or  book 15 minutes first →

Wondering what happens to your data? Read exactly how we handle it.